What Is a Savings Rate? Why It’s the Most Important Personal Finance Metric?
Ask someone about their financial health and they’ll probably tell you about their income. “I make $75,000 a year,” or “We’re a six-figure household now.” Income feels like the most important number because it’s what we use to compare ourselves to others, what determines our perceived success, and what we think we need to increase to improve our financial situation. But here’s the uncomfortable truth that most people learn far too late: your income is one of the least important numbers in determining whether you’ll achieve financial security, and there’s a much better metric that actually predicts your financial future with remarkable accuracy.
That metric is your savings rate the percentage of your income that you keep rather than spend. It’s simultaneously the simplest and most powerful number in personal finance, yet most people have never calculated it and couldn’t tell you what theirs is within ten percentage points. This isn’t just an interesting statistic to track; it’s the single best predictor of when you’ll achieve financial independence, how prepared you are for emergencies, and whether you’re building wealth or just treading water financially. Let’s break down exactly what a savings rate is, why it matters more than almost any other financial metric, and how understanding it can fundamentally transform your financial life.
Defining Savings Rate: The Basic Formula
At its core, your savings rate is beautifully simple: it’s the percentage of your income that you save rather than spend. The basic formula looks like this:
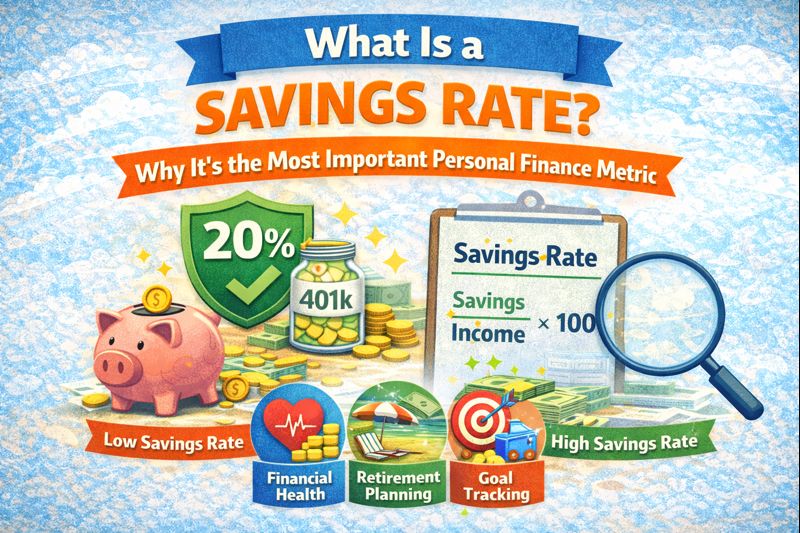
Savings Rate = (Amount Saved ÷ Income) × 100
If you earn $5,000 monthly and save $1,000 of it, your savings rate is 20%. If you earn $100,000 annually and save $25,000, your savings rate is 25%. The math is straightforward—it’s just division and multiplication that you learned in grade school.
But here’s where it gets slightly more nuanced, and where many people make calculation errors that distort their understanding of their financial position. You need to be consistent about what you’re measuring. Most financial experts recommend using gross income (before taxes) as your denominator because it’s more conservative, easier to track consistently, and makes your numbers comparable to standard financial advice that typically references gross income.
So if you earn $80,000 gross annually but take home $58,000 after taxes, and you save $12,000, your savings rate is 15% ($12,000 ÷ $80,000), not 20.7% ($12,000 ÷ $58,000). Both calculations are mathematically valid, but using gross income is the standard that makes your savings rate comparable to benchmarks and recommendations you’ll encounter.
What Counts as Savings?
The “amount saved” numerator includes more than just what goes into your savings account. It encompasses everything that builds your net worth and moves you toward financial independence:
- 401(k), 403(b), and other workplace retirement contributions
- Employer matching contributions (yes, this counts even though it’s not technically your money going in)
- IRA contributions (both traditional and Roth)
- HSA contributions
- Deposits to savings accounts
- Money invested in taxable brokerage accounts
- Any other investments that build wealth
What generally doesn’t count: minimum debt payments (you borrowed that money, paying it back is an obligation, not savings), money you’re setting aside for planned near-term spending like vacations or gifts (that’s budgeting, not saving), or checking account balances that just sit there as spending buffers.
The key distinction is between money you’re keeping for future financial security versus money you’re managing for current and near-term spending. Your savings rate measures the former, not the latter.
Why Savings Rate Trumps Income as a Financial Health Indicator
Here’s a question that reveals why savings rate matters more than income: Who’s in better financial shape—Person A earning $150,000 annually with a 5% savings rate, or Person B earning $60,000 with a 30% savings rate?
Most people’s intuition says Person A because they earn so much more. But Person A is saving $7,500 annually while spending $142,500. Person B is saving $18,000 annually while spending $42,000. Person B is accumulating wealth more than twice as fast in absolute dollars despite earning less than half as much. More importantly, Person B only needs to accumulate enough wealth to support a $42,000 lifestyle, while Person A needs enough to support a $142,500 lifestyle—more than three times as much total wealth required.
This is why savings rate is superior to income as a financial health metric: it captures both sides of the wealth-building equation simultaneously. High income means nothing if you spend it all. Low expenses mean nothing if you have no income to create a surplus. Savings rate captures the gap between earning and spending, which is what actually builds wealth.
Income also has limited predictive power about financial outcomes. We all know high-earners who are perpetually broke and modest earners who are financially secure. Income creates potential, but savings rate determines outcomes. You can earn your way to high income through career success, but you can only save your way to financial independence, and savings rate measures how effectively you’re doing that.
The Control Factor
Perhaps most importantly, savings rate is largely within your control while income often isn’t, especially in the short term. You can decide tomorrow to increase your 401(k) contribution by 2%, cut discretionary spending by $200 monthly, or optimize a major expense—these decisions directly and immediately improve your savings rate.
You generally can’t decide to earn 20% more tomorrow. Income growth requires time, skill development, job changes, or market conditions aligning. It’s important but not immediately actionable. Savings rate is immediately actionable, which makes it a much more useful metric for actually managing your financial life day-to-day.
How Savings Rate Predicts Your Financial Timeline
The most powerful aspect of savings rate is its direct mathematical relationship to your timeline for financial independence. This isn’t aspirational or theoretical—it’s a predictable calculation based on how wealth accumulation actually works.
Your savings rate determines two crucial factors simultaneously: how fast you accumulate wealth (higher savings rate = faster accumulation) and how much wealth you need (higher savings rate = lower spending = less wealth required). These compound each other to create dramatic differences in timeline based on seemingly small differences in savings rate.
Using the widely accepted 4% safe withdrawal rate (meaning you need 25 times your annual spending saved to retire safely), here’s approximately how long it takes to reach financial independence at different savings rates, assuming 5% real investment returns:
- 5% savings rate: about 66 years of work
- 10% savings rate: about 51 years of work
- 15% savings rate: about 43 years of work
- 20% savings rate: about 37 years of work
- 25% savings rate: about 32 years of work
- 30% savings rate: about 28 years of work
- 40% savings rate: about 22 years of work
- 50% savings rate: about 17 years of work
- 60% savings rate: about 12.5 years of work
- 75% savings rate: about 7 years of work
Look at how dramatically the timeline changes. Going from a 10% savings rate to 20% cuts 14 years off your working career. Increasing from 20% to 40% saves another 15 years. These aren’t marginal improvements—they’re transformational differences in life trajectory, all determined by a single percentage.
This mathematical relationship exists because you’re not just saving faster at higher rates—you’re also building toward a lower target because your spending is lower. Someone saving 50% of a $100,000 income is living on $50,000, so they only need $1.25 million saved (25 times $50,000). Someone saving 10% of that same $100,000 is living on $90,000, requiring $2.25 million saved—almost twice as much wealth needed despite earning the same income.
Why This Makes Savings Rate the Most Important Metric
No other financial metric has this kind of direct, mathematical predictive power over your financial timeline. Not your income, not your net worth, not your investment returns. Your savings rate, maintained consistently over time, determines with reasonable precision when you can achieve financial independence. That’s why it deserves to be called the most important personal finance metric—it’s the one that most directly answers the question “When can I stop working if I choose to?”
Savings Rate vs. Other Financial Metrics: The Comparison
To fully appreciate why savings rate deserves the crown as most important metric, let’s compare it to other commonly tracked numbers and see why it’s superior for most purposes.
Income: Shows earning capacity but not wealth accumulation. Two people with identical incomes can have completely different financial trajectories based on savings rate. Income is an input, not an outcome. It’s necessary but not sufficient for financial success.
Net Worth: Shows current position but not trajectory or sustainability. Someone with $500,000 net worth but a negative savings rate (spending more than they earn) is in worse shape than someone with $100,000 and a 30% savings rate. Net worth is a snapshot; savings rate is a movie showing where you’re heading.
Credit Score: Shows borrowing reliability but says nothing about wealth building. You can have an 800 credit score while living paycheck to paycheck with zero savings. It’s important for accessing credit, but it doesn’t measure financial health or progress toward independence.
Debt-to-Income Ratio: Shows leverage but not saving behavior. Someone with low debt and high income but zero savings isn’t financially healthy—they’re just not using debt to fund their lifestyle. They’re still spending everything they earn.
Investment Returns: Important once you have wealth, but you need savings rate to build wealth in the first place. In early years, a 2% improvement in savings rate matters far more than a 2% improvement in investment returns because your contributions dwarf your portfolio. Returns become more important as wealth grows, but savings rate is what builds the wealth that returns then multiply.
The Savings Rate Advantage
What makes savings rate superior is that it’s actionable, forward-looking, and directly connected to your most important financial goal—having enough wealth to sustain your lifestyle indefinitely. It measures the behavior that creates financial independence while most other metrics measure circumstances, history, or capabilities.
You can improve your savings rate starting today through decisions you control. You can’t immediately improve your net worth (that takes time), your income (that takes career development), or your investment returns (that’s mostly market-dependent). But you can increase your savings rate this month by adjusting spending or directing more income to savings. That actionability makes it the metric worth obsessing over.
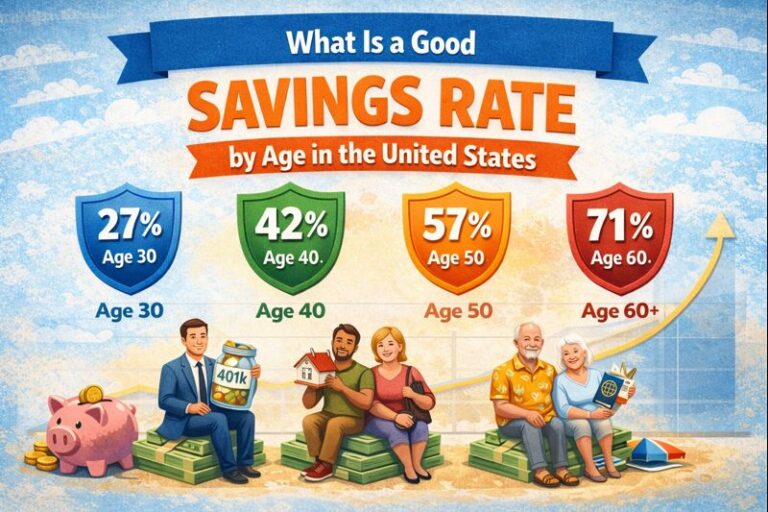
The Life-Stage Relevance of Savings Rate
Your savings rate isn’t just important in aggregate—it’s relevant and actionable at every stage of financial life, which further establishes its primacy as a metric.
In Your 20s: Your savings rate determines whether you’re building wealth or just earning and spending. Your income is probably low, so absolute dollars saved are small. But establishing a 15-20% savings rate in your 20s creates a habit and allows compound growth decades to work. Your savings rate matters more than your salary at this stage because time is your greatest asset.
In Your 30s and 40s: Your savings rate should be accelerating as income grows. This is your wealth-building prime, and your savings rate determines whether you’re capitalizing on peak earning years or letting lifestyle inflation consume income growth. A stagnant savings rate despite rising income means you’re wasting your highest-earning years.
In Your 50s: Your savings rate becomes urgent. You can see retirement approaching, and the math is now concrete rather than abstract. Your savings rate over the next 10-15 years will largely determine whether retirement is comfortable, delayed, or challenging. There’s still time to course-correct with an aggressive savings rate, but the window is closing.
In Early Retirement: Your savings rate shifts from positive (accumulating) to negative (drawing down), but the principle remains—you’re managing the rate at which wealth changes. A sustainable withdrawal rate is really just a “negative savings rate” that your portfolio can support indefinitely.
Universal Relevance Across Financial Situations
Savings rate is also relevant regardless of income level, family situation, or geography. The person earning $40,000 in rural Ohio and the person earning $200,000 in San Francisco both need to track savings rate. The methodology is identical; only the absolute dollars differ. This universal applicability makes savings rate a more useful metric than income-dependent measures.
A 25% savings rate means the same thing—living on 75% of income and saving the rest—whether you earn $50,000 or $500,000. The timeline to financial independence is similar (though the absolute wealth accumulated differs). This universal meaning makes savings rate the great equalizer in personal finance discussions.
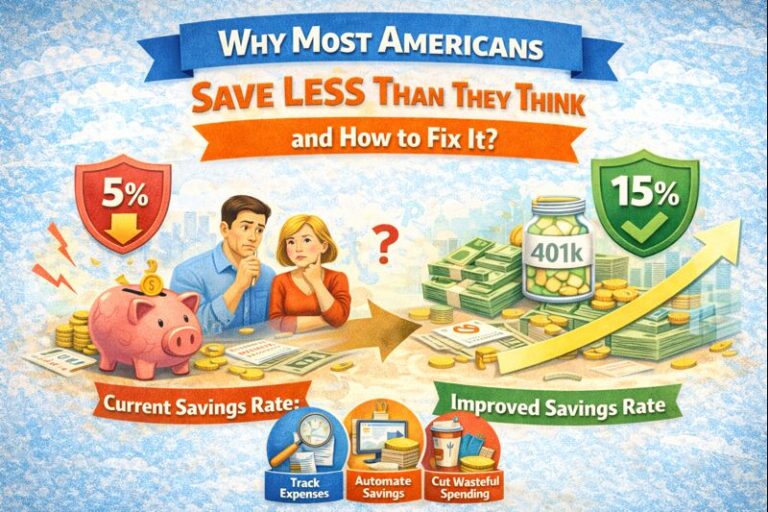
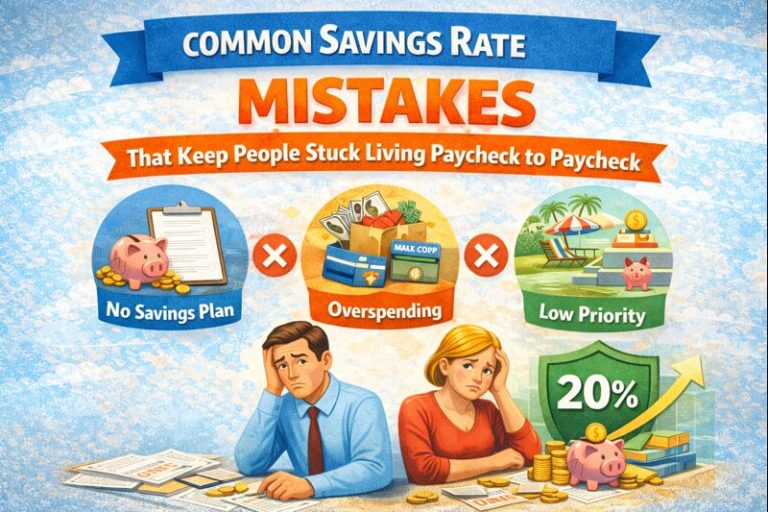
Common Savings Rate Mistakes That Undermine the Metric’s Value
Understanding savings rate’s importance is valuable, but only if you calculate and apply it correctly. Several common mistakes undermine the metric’s usefulness.
Mistake 1: Inconsistent Denominators
Using gross income for some calculations and net income for others creates meaningless numbers. Pick one (preferably gross) and stick with it religiously. Mixing them is like measuring distance in miles for one trip and kilometers for another then claiming you drove the same distance—the math doesn’t work.
Mistake 2: Forgetting Employer Contributions
Your employer’s 401(k) match is part of your total savings even though it’s not money leaving your paycheck. Excluding it understates your actual savings rate and can lead to undersaving elsewhere because you think you’re further behind than you are.
Mistake 3: Counting Non-Savings as Savings
Money you’re saving for Christmas gifts or a vacation isn’t really savings—it’s deferred spending. When you spend it, it never accumulated as wealth. Only count money that’s actually building your net worth over the long term.
Mistake 4: Not Accounting for Irregular Contributions
That $5,000 bonus you invested, the $3,000 tax refund you saved, the $2,000 in extra mortgage principal you paid—these count toward your annual savings even though they’re not part of your monthly routine. Calculate savings rate annually to capture these irregular contributions.
Mistake 5: Treating It as Static
Your savings rate should evolve as income grows, life circumstances change, and you progress toward goals. Calculating it once and never revisiting means you’re not using it as a management tool—just as a one-time measurement. Track it at least annually, preferably quarterly.
How to Calculate and Track Your Savings Rate Effectively
Given its importance, you should be calculating your savings rate regularly and accurately. Here’s the practical method:
Monthly Snapshot Calculation:
- Add up all income received this month (gross, before taxes)
- Add up everything saved this month (retirement contributions including match, savings deposits, investment contributions)
- Divide savings by income, multiply by 100
This gives you your savings rate for the month, useful for immediate feedback on behavior.
Annual Comprehensive Calculation:
- Total all gross income for the year (W-2 income, bonuses, side income, everything)
- Total all savings for the year (all retirement contributions, all employer matching, all savings deposits, all investment contributions, including irregular contributions like bonus investments or tax refund savings)
- Divide total savings by total income, multiply by 100
This annual calculation is your true savings rate—it’s comprehensive and captures the complete picture including irregular contributions you might miss in monthly calculations.
The Tracking System
Create a simple spreadsheet with monthly columns tracking income and savings. This takes 5-10 minutes monthly to update but provides invaluable visibility into your most important financial metric. Watch for trends: Is your savings rate improving over time? Are certain months consistently worse? This visibility enables management.
Set target savings rates for different timeframes: “15% this quarter, 18% by year-end, 20% by next year.” Specific targets create accountability. Without targets, savings rate is just an interesting number. With targets, it becomes a managed metric that drives behavior change.
Using Your Savings Rate to Make Better Financial Decisions
Once you know your savings rate and understand its importance, it becomes a decision-making tool for virtually every financial choice.
Career Decisions: That new job offers 15% more money but requires longer hours. Will it allow you to maintain or improve your savings rate? If the extra hours mean more spending on convenience and less energy for cooking or frugality, the higher income might not improve your financial trajectory. Savings rate helps you evaluate whether career changes actually advance your financial goals.
Spending Decisions: Before a major purchase, ask: “Will this materially impact my savings rate?” A $30,000 car versus a $15,000 car might reduce your savings rate by several percentage points for years. That might be worth it, or it might not—but framing it in savings rate impact makes the trade-off explicit.
Housing Decisions: Choosing housing that costs 25% of income versus 40% might increase your savings rate by 10+ percentage points. That single decision—where you live and how much it costs—could change your retirement timeline by a decade. Savings rate makes the impact of housing costs impossible to ignore.
Lifestyle Decisions: Should you really upgrade every aspect of life when you get a raise? Your savings rate immediately reveals whether income growth is translating to wealth building or just lifestyle inflation. If your savings rate hasn’t increased despite a 20% income increase, you’ve consumed the entire raise through lifestyle—maybe that was the right choice, but at least you know.
The Transformational Impact of Savings Rate Awareness
The most powerful thing about tracking savings rate isn’t the number itself—it’s how awareness of that number changes your relationship with money and your financial decision-making.
Before people start tracking savings rate, financial decisions are often fuzzy and emotional. “Can we afford this vacation?” means “Is there money in the checking account?” or “Does it feel okay to spend this?” After tracking savings rate, that question becomes concrete: “Will this vacation reduce our savings rate below our target? If so, is it worth the trade-off of delaying financial independence by X months?”
This shift from vague to concrete is transformational. Suddenly spending has visible consequences measured in the metric that matters—progress toward financial independence. The $200 dinner doesn’t just cost $200; it costs progress toward your goals, quantified in your savings rate for that month.
Many people report that simply starting to track savings rate—without any initial attempt to change it—leads to natural behavior improvements. Awareness creates accountability. Seeing that your savings rate was only 8% last month when your target is 20% creates motivation to close that gap. The metric itself drives behavior change.
The Long-Term Compound Effect
Track your savings rate for five years and you’ll have a financial autobiography. You’ll see which years you made progress, which years you stagnated, what behaviors correlate with high savings rates, and what circumstances derailed you. This data is invaluable for understanding your own financial patterns and making better choices going forward.
You’ll also see the compound effect of small improvements. A savings rate that goes from 12% to 15% to 18% to 22% over four years represents enormous progress—potentially decades less work before financial independence. That progression is only visible if you’re tracking consistently over time.
Making Savings Rate Your North Star Metric
In business, companies identify their “north star metric”—the one number that best indicates whether the business is healthy and heading toward its goals. Your savings rate should be your personal finance north star metric.
Not that other numbers don’t matter—net worth, income, debt levels, investment returns all matter. But if you could only track one number, savings rate would give you the most useful information about whether you’re on track for financial success. It captures earning, spending, and progress toward independence in a single percentage.
Make checking your savings rate a regular habit, like checking your weight if you’re managing health or checking your speed if you’re driving toward a destination. Monthly is ideal, quarterly is acceptable, but annual is the minimum. This regular check-in keeps your most important financial metric visible and top-of-mind.
Set ambitious but achievable savings rate targets and celebrate when you hit them. Reached 20% savings rate for the first time? That’s worth celebrating more than a raise or a bonus because it represents discipline and progress, not just circumstances. Building a culture of celebrating savings rate achievements (with yourself, with a partner, with accountability friends) reinforces the behavior.
Your savings rate is the most important personal finance metric because it’s the best predictor of when you’ll achieve financial freedom, it’s actionable and within your control, and it works universally regardless of income or circumstances. Calculate it, track it, manage it, and improve it—these simple actions will do more for your long-term financial success than almost any other financial behavior. Understanding what your savings rate is and why it matters is the foundation; using it to drive better decisions is how you transform knowledge into the financial freedom you actually want.